Showing posts with label stratigraphy. Show all posts

01 July 2014

The Evolution of Cranial Capacity in Humans and Stem-Humans

(Hey, I'm actually writing on the blog's title subject today!)

Here's a chart I've been working on for a while:


This shows all known human and stem-human individuals, plotted according to stratigraphy and cranial capacity (endocranial volume). The fossil individuals with known cranial capacity are highlighted as white circles; other fossil individuals' probable capacity is inferred from these. The "chimpanzee range" shows the span between a normal female bonobo chimpanzee (Pan paniscus) and a normal male common chimpanzee (Pan troglodytes) (Begun & Kordos 2004); the full range for chimpanzees (Pan) is slightly larger (but not much). The "human range" shows where about 90% of living humans fall (Burenhult 1993). UPDATE: My mistake, it's the range of ~90% of living humans combined with the range of Upper Pleistocene humans (which is actually higher, on average).

Some notes:

02 January 2013

All Known Great Ape Individuals (Messinian to Present)

Happy 2013, everyone!

Recently I announced a code package I was working on, called 
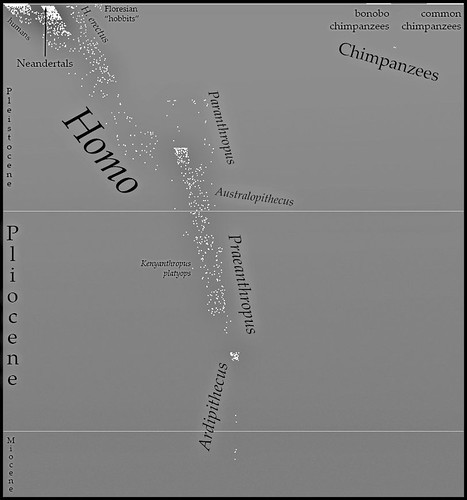
Haeckel, for generating vector-based charts related to evolutionary biology. Here's an image I've created using it:

Known Great Ape Individuals
This chart represents all known hominid individuals (Hominidae = great apes, including humans and stem-humans) from the Messinian to the present, erring on the conservative side when the material is too poor to determine the exact number.

If you've been following this blog for a few years you may remember an earlier version of this. I've done a lot of refinement to the data since then. The earlier versions were dissatisfying to me because the horizontal axis was essentially arbitrary. For this version I used matrices from a phylogenetic analysis (Strait and Grine 2004, Table 3 and Appendix C) of craniodental characters to generate a distance matrix, and then inferred positions for other taxa based on phylogenetic proximity and containing clade. This is similar to the metric I used in this chart, except that it incorporates Appendix C, uses inference, and averages distance from humans against distance from [Bornean] orangutans. Don't be mistaken  this is still arbitrary. But it's a bit closer to something real.

Stray notes:
  • I'm pretty sure there are Pliocene stem-orangutans somewhere, right? Might have some work left to do on that data.
  • The dot with no taxon above "Australopithecus" is an indeterminate stem-human from Laetoli. It should probably go further left.
  • The Ardipithecus bubble includes the poorly-known "Australopithecus" praegens. (Although in some runs it moves outside  there's a random element to the plotting.)
  • The Holocene is barely visible up at the top. What a worthless epoch.
  • Homo floresiensis (hobbits) are far to the left of Homo sapiens because I placed them outside Clade(Homo erectus  Homo sapiens).
  • You may recall Lufengpithecus? wushanensis as "Wushan Man", as it was originally placed in Homo erectus. (Hey, it's just teeth.)
  • A couple of fossil chimpanzees, lots of fossil orangutans, but no fossil gorillas. :(
    • (Unless you count Chororapithecus, but that's pre-Messinian. Very pre-Messinian. Suspiciously pre-Messinian....)
  • Look at all that overlap between Homo, Paranthropus, and Australopithecus!
    • I have a feeling, though, that if I added another dimension, Paranthropus and Homo would jut out in opposite directions.
    • Reclassifying Australopithecus sediba as Homo sediba would also decrease the overlap. (Although its position is inferred  actually scoring it might do the same thing.)
    • It's frustrating that the type species of Australopithecus and Paranthropus are also just about the most similar species across the two genera.
  • Kenyanthropus and Praeanthropus have been provisionally sunk into Australopithecus.
  • Should we just sink Orrorin and Sahelanthropus into Ardipithecus? Why not?
  • My guess is that if I added postcranial characters, the stem-humans would all shift right (humanward). Oh, for a good matrix of postcranial characters....
Update
Oh yeah, and if you want a peek at the data, go here.

15 January 2010

Mangani Individual Chart Update

First things first: want to contribute to Haitian relief? Here's a guide to the appropriate charities.


Second things second: I just posted an update to my diagram showing all known mangani individuals.


Previous version here.

I'm trying a different value scheme to differentiate the vertices and the text. I also revised the earliest species (kadabba, ramidus, and anamensis) based on a rigorous review of the primary literature, and added one early species that had been overlooked (praegens, which may be a nomen dubium but is certainly a mangani or stem-mangani). The later species were revised a bit as well, but not as rigorously.

I really wish there were some place that just listed every known locality with its number of specimens and least possible number of individuals. I've been slowly compiling my own as a Google spreadsheet, but I'd like a better way to catalogue it. Hmmm, perhaps it's time to return to another project of mine.

22 July 2009

"The Case for Human Evolution" - Illustrations

I have been working on an essay entitled The Case for Human Evolution for a while. I've just posted some illustrations I've been working on:


Enjoy!

21 September 2008

Mystery Chart Solved

Mike Hanson pretty much got it (after Malacoda's initial close guess).

Click to see full size.


Each dot represents a known individual. Vertical distribution is, of course, geochronological. Horizontal distribution is meant to be more or less morphological, but it's completely subjective. If it were more rigorous, the vertical distribution would be more stratified, but this is a good approximation.

Some interesting things to note:
  • Wherever there's a gap, it's due to age and/or a rainforest habitat. (Note that the only definite chimpanzee fossils we have, which are all teeth, are from a savannah environment.)
  • Genetic data indicates that the chimpanzee-human split occurred around the Ardipithecus level. In fact, Ardipithecus kadabba (the earlier Ardipithecus population) shares a possible synapomorphy with chimpanzees (the canine cutting complex) not seen in earlier fossils, so it could be a very early stem-chimpanzee.
  • The earliest populations all have some vague indications that they may have been more habitually bipedal than chimpanzees are. Perhaps instead of humans arising from a chimpanzee-like ancestor, we both arose from an ancestor that was sort of in between. (Even today, chimpanzees are certainly not completely quadrupedal.)
  • If you look closely near the dark splotch that is our species, you'll see a dot lying between it and Neandertals. This represents a fossil of a child, which lived after all known Neandertals, with some traits of both species. A hybrid?
  • We have a damn good fossil record.

20 September 2008

A Clue to the Mystery Chart

Malacoda got close (5 points), but nobody's guessed it yet. Maybe it was too hard. Here's a clue:


(Click for full size.)